
Alki David Files Emergency Preservation Order in Dallas Federal Court Amid NXIVM and Industry Connections

Media entrepreneur Alki David seeks to preserve digital records and witness materials in the Eastern District of Texas, alleging ties to NXIVM, David Boies and global brands. The filers argue cross‑border evidence may be crucial if records vanish.
- In a United States federal court, Alki David has filed an emergency preservation order, requesting the court to keep intact a wide range of digital and paper documents before they can be lost or deleted. David claims the evidence spans the NXIVM case, a networked map that includes high‑profile attorneys, celebrities, and Fortune 500 companies. He says that no legal findings have yet been made and that the forthright filing is meant to safeguard potential evidence that could illuminate connections across corporate ecosystems.


Watch News on TV
Catch up on today's news
MORE TOP STORIES

FEATURED

bbc.co.uk
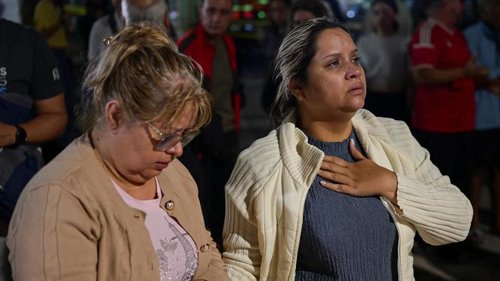
Venezuela Grapples with Twin Earthquakes Amid Political Turmoil

Witness Vusimusi “Cat” Matlala confesses to bribery, fraud and money‑laundering in a high‑profile police graft case, with implications for senior officers and ongoing investigations.
bbc.co.uk

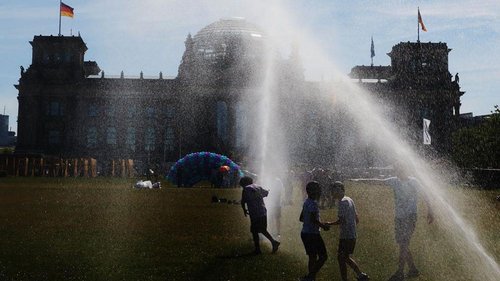
Heatwaves moving from Southern Europe to Germany, Czechia and beyond, leading France to boost its health alert level amid rising temperatures and deaths.
bbc.co.uk

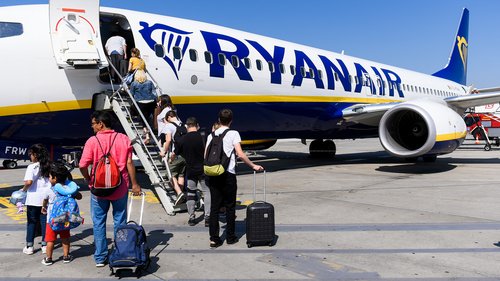
UK airline Ryanair now offers free seats for children travelling with parents following a Competition and Markets Authority investigation, prompting debate over industry norms and consumer rights.
bbc.co.uk

IBM unveils a chip design that could pack 100 billion transistors onto a fingernail‑sized chip, pushing the limits of semiconductor scaling.
bbc.co.uk

Advertisment
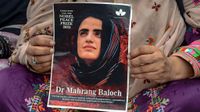
Dr Mahrang Baloch, a Balochistan activist once praised for her fight against enforced disappearances, is now serving a life sentence in Pakistan.
bbc.co.uk

UK graduate earnings vary widely by subject – medicine tops the list while creative arts can underperform non‑graduates.
bbc.co.uk

UK residents share creative ways to stay cool as temperatures reach record highs in June.
bbc.co.uk

A new state department seeks to tackle loneliness and care gaps for Kerala’s ageing population, blending community support with professional services.
bbc.co.uk

The International Atomic Energy Agency announced that inspectors will be scheduled to enter Iranian sites as a condition of a newly signed peace deal with the United States, marking a significant step toward stabilizing the region.
bbc.co.uk
France's record heat prompts debate over air‑conditioning, drawing support from right‑wing and Green parties amid rising temperatures.
bbc.co.uk

Advertisement

bbc.co.uk
Venezuela Rocked by Twin 7.2 and 7.5 Earthquakes: Residents Recall Worst Felt Seismic Event

Ivan Cepeda concedes defeat in Colombia’s nail‑biting presidential run‑off
bbc.co.uk

EU’s digital border system sparks long lines for holidaymakers
bbc.co.uk
Air‑conditioning sparks a political clash amid France’s hottest day
bbc.co.uk

Shipping traffic rises in Strait of Hormuz as US‑Iran deal takes effect
bbc.co.uk
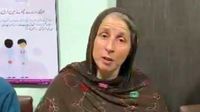
French Woman and Children Rescue After 12 Years of Abuse in Pakistan
bbc.co.uk
IAEA Chief Confirms Inspector Visits to Iran Sites as Part of War Settlement
bbc.co.uk

International Flags in the FIFA World Cup: 2026 Highlights How Many Players Wear a New Nation’s Colors
bbc.co.uk
bbc.co.uk
Trump Seeks $87 Billion for Iran Conflict Funding Amid Congressional Pushback
A fire last month at Utumishi Girls’ School in Gilgil killed 16 students and injured dozens. Kenyan prosecutors have announced plans to charge eight students with murder, each facing 16 counts linked to the tragedy. The incident followed safety breaches such as overcrowded dormitories and a locked exit door, prompting calls for stronger school safety measures in Kenya.
bbc.co.uk

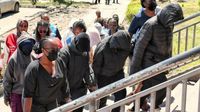
In Texas, a group linked to Antifa staged a violent protest at the Prairieland Detention Center on Independence Day, firing fireworks, shooting a police officer and vandalising property. US prosecutors said the defendants were part of a broader network that seeks to overthrow the US government, and the Department of Justice charged them with terrorism‑related offenses. Acting Attorney General Todd Blanche called the prosecutions a swift response to “an assault on democracy.” Eight were now sentenced to a total of 450 years, ranging from 30 to 100 years per individual, while a ninth defendant faces sentencing next month.
bbc.co.uk

On 13 June, Leah Stewart was attacked by a shark while swimming near Sydney’s Coogee Beach, requiring multiple surgeries and leading to an induced coma. The 34‑year‑old teacher’s brother reported that doctors reduced her sedation, allowing her to stir, smile, and call her family ‘I love you’. Despite this first positive sign, she remains in critical condition, with further procedures scheduled. The incident follows a string of shark attacks in Australia this year, underlining the growing concerns around beach safety. While her outcome is uncertain, her brief awakening is being hailed by her family as a potential turning point.
bbc.co.uk

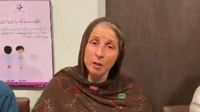
French Woman Rescued After 12 Years of Abuse in Pakistan: A Cross‑Border Human Rights Analysis
bbc.co.uk

France reports first Ebola case following return from Democratic Republic of Congo
bbc.co.uk

Ukrainian Drone Strikes Sever Power in Sevastopol, Crimean City
bbc.co.uk

France Braces for Another Day of Sweltering Heat as Europe Heatwave Spreads
bbc.co.uk
Western Europe Braces as Heat Records Shatter
bbc.co.uk

Kunal Shah Named Head of WhatsApp – A New Era for Global Messaging
bbc.co.uk

Stanford Graduates Provoke AI Debate as Job Futures and Politics Intertwine
bbc.co.uk
Featured Sections
BUSINESS
TRAVEL


POLITICS
HEALTH
TECH

Advertisement
Follow us

© 2024 SwissX REDD UK ltd. All Rights Reserved.